You Can Now See Our Lake District Detections Live
22 August 2026
The Lake District National Park Authority has published a Live Bird Call Detection page on their website. On it, anyone can see which birds the three acoustic monitors we installed across the park are detecting live.
We are really happy to be featured on the LDNP’s website and to have our detections put in front of the public rather than sitting in a private dashboard or as raw data.
What’s on the page
The page carries a live stats dashboard covering all three monitor locations - the Northern Office, the Southern Office, and the office near Kendal where our first station went in back in August 2025. Pick a site and you get two views:
- Top 10 - the species heard most often at that location.
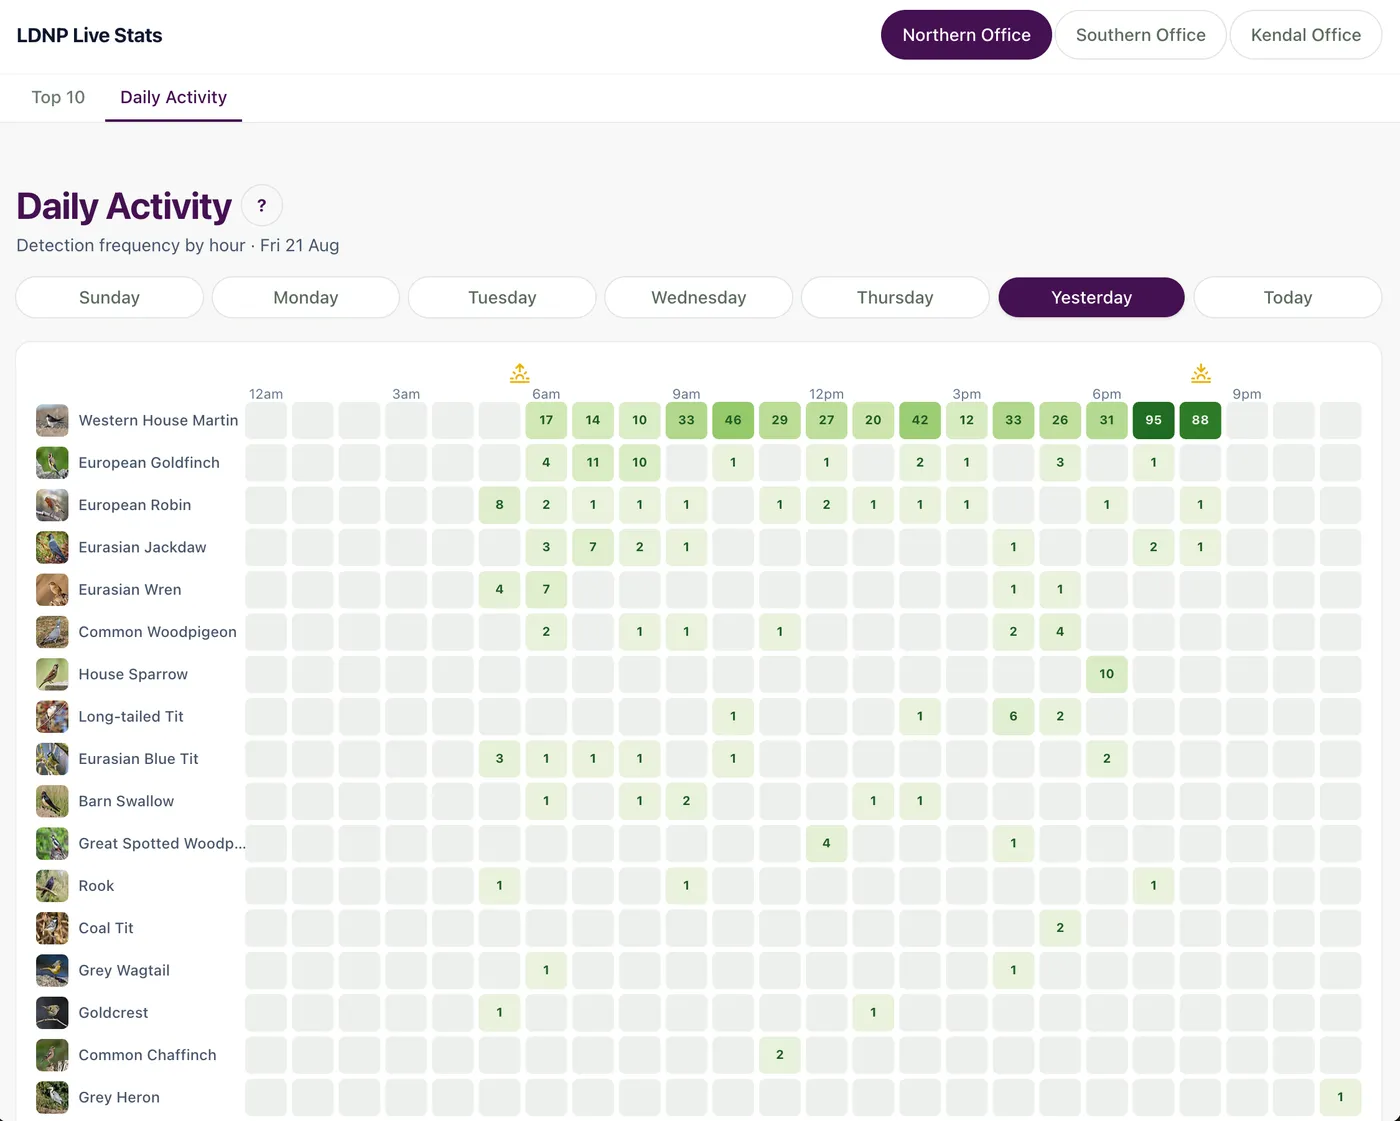
- Daily Activity - a heat map of detection frequency by hour, for today or any day in the past week.
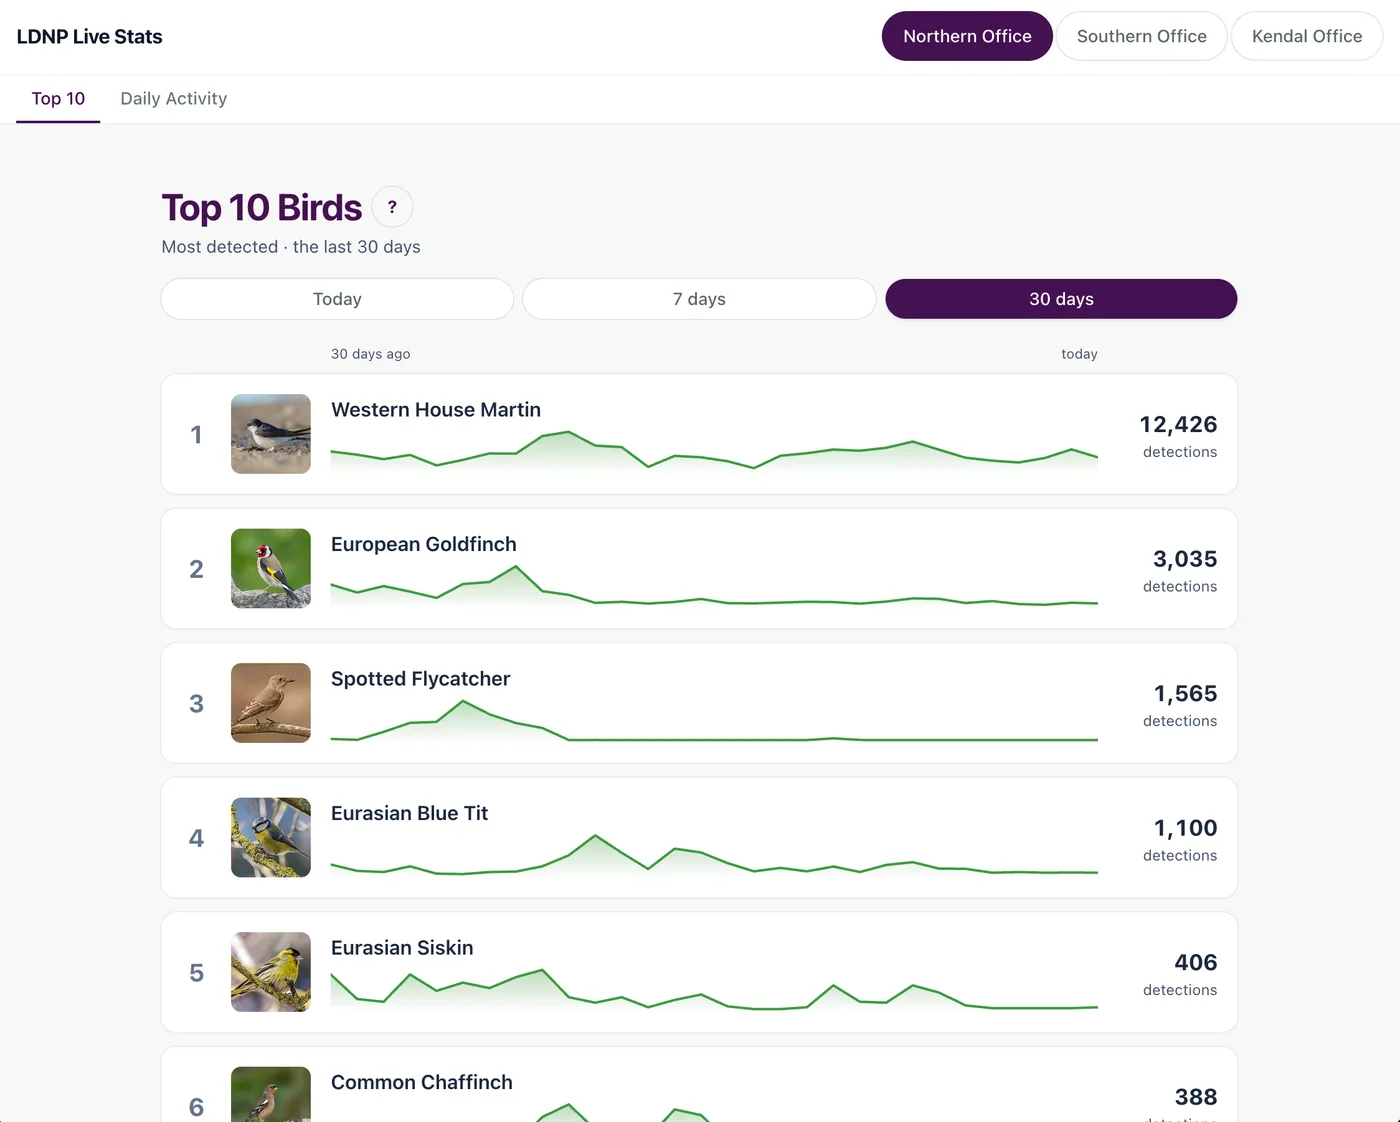
Top 10 ranks species by detection count over today, the last 7 days, or the last 30 days, with a sparkline showing how each one has come and gone across the period. The numbers give a sense of the sheer volume involved: at the Northern Office, Western House Martin alone accounted for 6,008 detections in thirty days.
If you select Daily Activity, you will see a heat map with species down the left and hours running across the top, the colour deepening where the number of detections is higher. It gives a great overview of which birds were active that day, and when.
Come back in a few weeks and it will look different again. The mix of birds shifts as summer visitors leave and winter migrants pass through, and this dashboard will update itself to show that happening, rather than describing it after the fact.
The build
The monitors aren’t the only part of this we built. The stats dashboard on the page is ours as well, adapted from Beakwatch, our open-source BirdNET-Go display, released earlier this year.
Beakwatch was originally designed to be a wall-mounted kiosk. The idea was to have a screen in the corner of an office (or nature reserve) cycling through detections for staff and visitors to see live. The same panels translated well into an embedded public dashboard, so rather than start from scratch we reworked what was already there. The hourly activity heat map and the most-detected species list both came across largely intact, with a site switcher added for the three locations. It’s a nice illustration of why we open-sourced Beakwatch in the first place. Anyone running BirdNET-Go can pick it up and do the same thing.
Where this came from
The first monitor went live near Kendal in August 2025 as a single Raspberry Pi with a USB microphone, running continuously to see what automated detection could add to conventional survey work. Two more followed. If you want the detail - the hardware, the BirdNET-Go setup, and what eight months of continuous recording actually produced - it’s all in our Lake District National Park case study.
Biodiversity data has a habit of ending its life in a PDF that nobody outside the organisation ever opens. Putting it somewhere people can simply have a look at it, on the website of the park they’re about to go walking in, feels like a much better use of it! So if you plan to visit the Lake District soon and want an idea of what species you might see there, take a look and we always welcome comments and questions if you have any.
If you manage a protected landscape and would like your monitoring data to be something visitors can explore rather than something filed away, get in touch.