What autumn sounds like in the Lakes
11 October 2026
You don’t need to be up on the fells to hear the seasons change. Bird monitors at the Lake District National Park’s offices in Keswick, Haverthwaite and Kendal have been following the changing birdsong, and between 20 June and 8 October 2026 they logged more than 155,000 bird detections.
The swifts went quiet at Haverthwaite and Kendal in August. As summer turned to autumn, the house martins and swallows followed, heading for Africa. The first pink-footed geese arrived, and the robins started singing again.
Every number here is a count of automatic identifications by BirdNET, not of individual birds.
House martins: a busy summer, then a quiet September
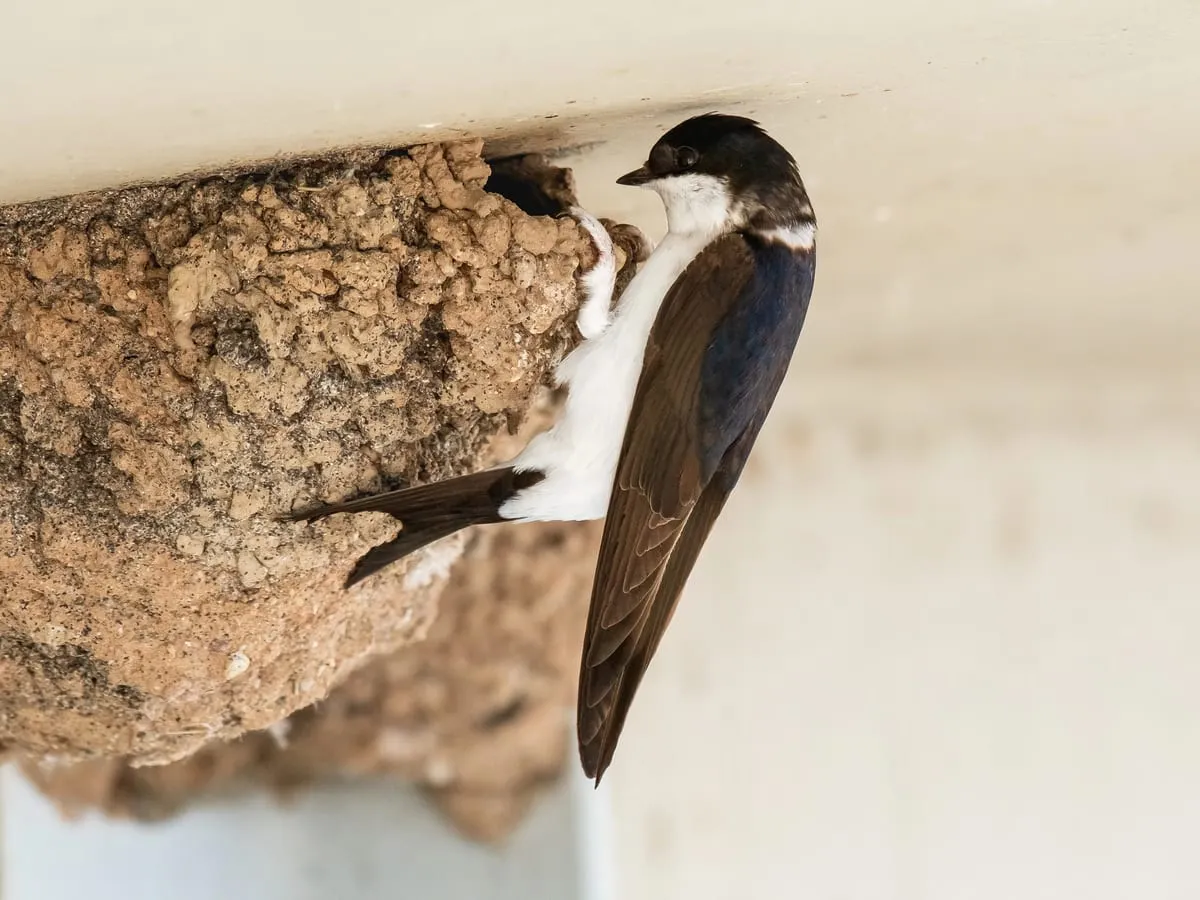
At Keswick, house martins were heard in large numbers through late June, July and August, then dropped away sharply in September. At Haverthwaite the biggest bursts came earlier in the summer, and by September they had almost stopped. Kendal heard far fewer all summer.

At Keswick, the monthly total fell from 12,518 in August to 1,810 in September. At Haverthwaite it fell from 1,570 to 40. By the time we pulled this data, the last house-martin detections were on 23 September at Keswick, 13 September at Haverthwaite and 30 September at Kendal. The microphones kept picking up plenty of other birds after those dates, so this isn’t a gap in the recordings. That fits their migration: house martins usually stay in Britain until September or October before heading to Africa, according to the BTO.
Why so few at Kendal? Of the three monitors, Kendal’s is in the most urban spot, with more traffic around it and less of the green space that supports the flying insects house martins feed on. We compared town and countryside monitors in more depth in Urban vs Rural: How Bird Vocal Patterns Shift.
Why house martins matter
House martins are in trouble. After years of decline, they were added to the UK Red List in 2021, the list of birds of highest conservation concern. Swallows have been traced all the way to South Africa, but house martins spend the winter high in the air and are almost never found again, so nobody yet knows exactly where in Africa British ones go; the BTO says their non-breeding range is still not known. Monitors like these can’t follow them to Africa, but they can record when the birds leave and when they come back. As the recordings build up, each year becomes a baseline for the next, so we can see whether house martins are arriving later, leaving earlier or being heard less often.
A closer look at Keswick
Plotting the same detections by time of day shows when house martins were detected most. In the chart below each column is one day, with daylight shaded between sunrise and sunset. The evening peak stands out, and it shifts earlier as the summer goes on, from around half past nine at night in July to about half past seven by September, keeping pace with sunset.
House martins catch insects in flight, so their day follows the insects rather than the dawn chorus. Before migrating they also gather in feeding flocks, which could bring more of them within earshot in the evenings.

Swallows leave too
Swallows followed the house martins out. Their detections fell from 243 in August to 32 in September at Keswick, and from 95 to 14 at Haverthwaite. The last swallows in the data were heard on 13 September at Keswick and 11 September at Haverthwaite, right in their usual autumn departure season. Kendal heard too few swallows all summer to show a trend.

Swifts went quiet earlier
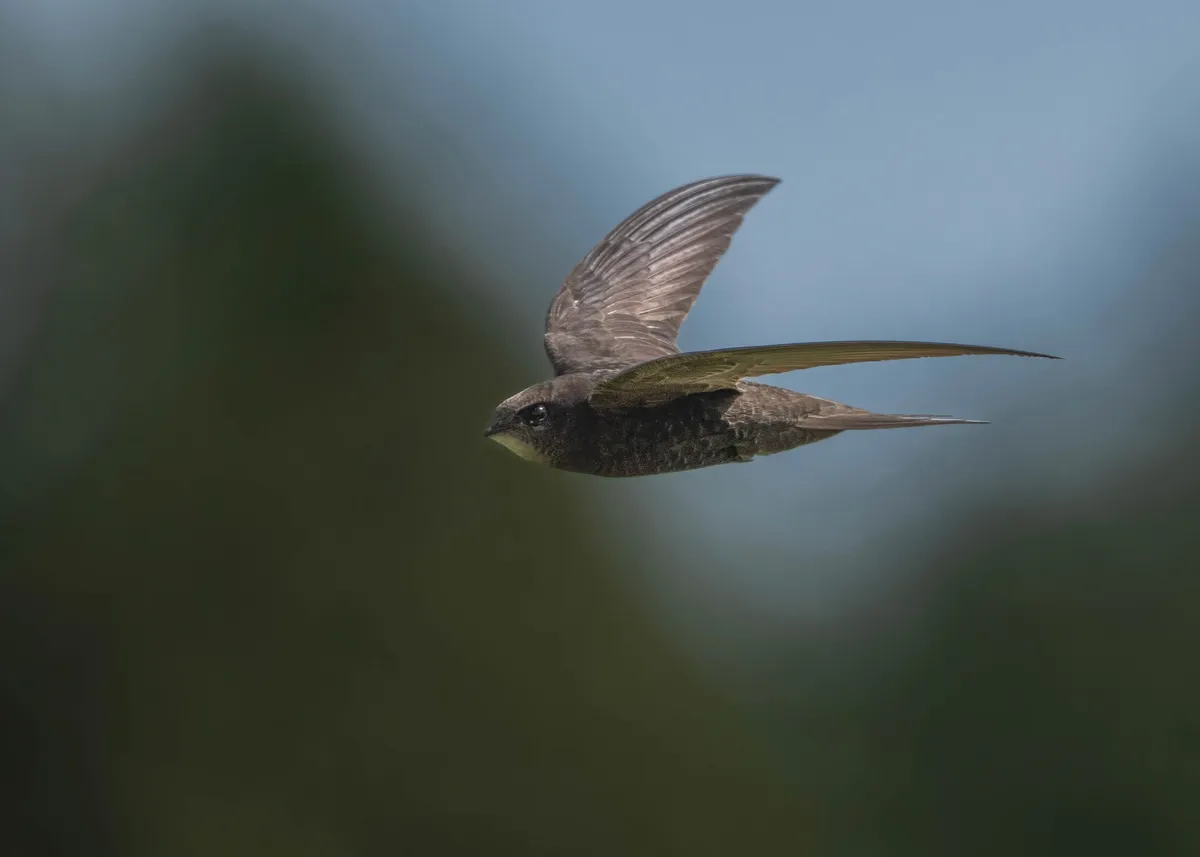
Haverthwaite had a busy swift summer: 701 detections in July, falling to just nine in August, with the last on 6 August. Kendal followed a similar pattern, dropping from 318 to 29, with its last detection on 15 August. Both monitors kept recording other birds afterwards, but neither logged another swift before our data ends on 8 October.
That earlier quiet spell fits the swift’s shorter summer visit: the BTO records departures beginning in mid-July. The detections suggest a seasonal change, rather than telling us exactly when the last bird left. Keswick logged just 45 swift detections across the whole window, scattered into September; the chart focuses on the clearer patterns at Haverthwaite and Kendal.

The first winter visitors
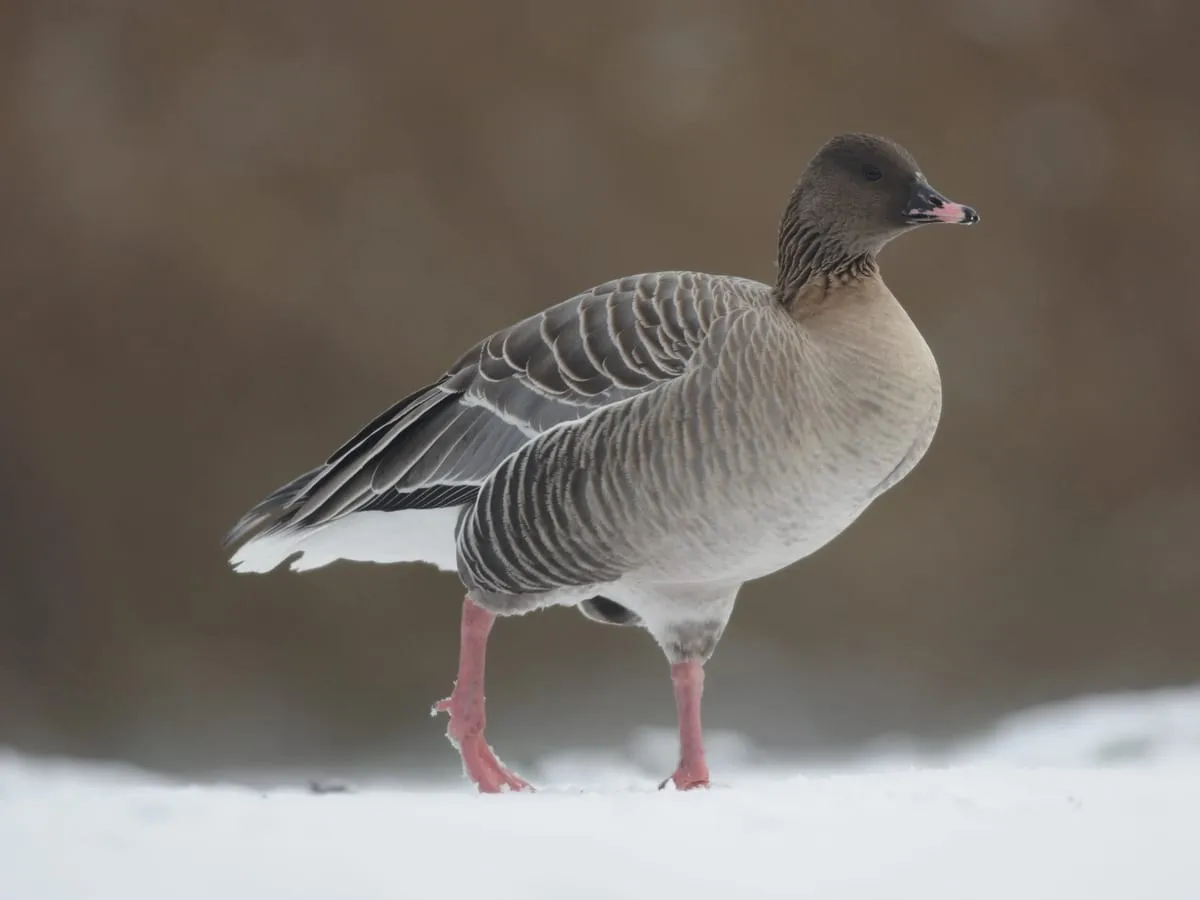
The first pink-footed geese were heard at Kendal on 7 September, Haverthwaite on 8 September and Keswick on 10 September. That’s right on time, as pink-footed geese arrive from Iceland and Greenland from September.
Robins find their voice
Not every change is about migration. Some birds stay all year and simply change their tune. Robin detections rose at all three offices as summer ended, and at Kendal they jumped from 587 in August to 2,695 in September. Robins sing through autumn to defend their winter territories, so this is likely the same birds singing more, rather than more robins.

Plotting them by time of day shows when they were detected. At Haverthwaite, the morning peak starts a little later each week from late August, following sunrise.

Follow the seasons with us
These three monitors let us follow the seasons right through the year, even on days when nobody is outside with a notebook. For students and local wildlife groups, they’re a great starting point for questions like these:
- When does summer activity peak?
- Which sounds mean autumn has arrived?
- How do different places compare?
You can see what the monitors are hearing right now on the National Park’s live bird call detection page.
About the data and charts
This article uses the three National Park office monitors: Northern Office in Keswick, Southern Office in Haverthwaite and Kendal Office in Kendal. All charts and totals use 20 June–8 October 2026. This window contains 155,233 retained detections across the three exports after excluding rejected records and duplicate IDs. Haverthwaite has one day without records, 15 July, shown in grey. The swallow chart includes Keswick and Haverthwaite; Kendal has too few swallow records to show a useful trend. The swift chart includes Haverthwaite and Kendal; Keswick’s sparse swift records are summarised in the text.
A species count is zero only on days with some non-rejected records of other birds. Days with no records are left unknown, including dates before an export begins. Each trailing average requires seven consecutive days with records and includes the plotted day and the six before it. Neither those days nor individual heatmap squares establish continuous recorder uptime.
Daily totals reflect recorded vocal activity, not numbers of birds or distinct calls. Microphone position, weather, behaviour and recording settings affect the counts. Score distributions changed over the season; these figures cannot fully control for equipment or model changes. Compare the timing within each panel rather than treating differences between sites as differences in bird abundance. Each daily-count panel has its own vertical scale.